Scene Insight
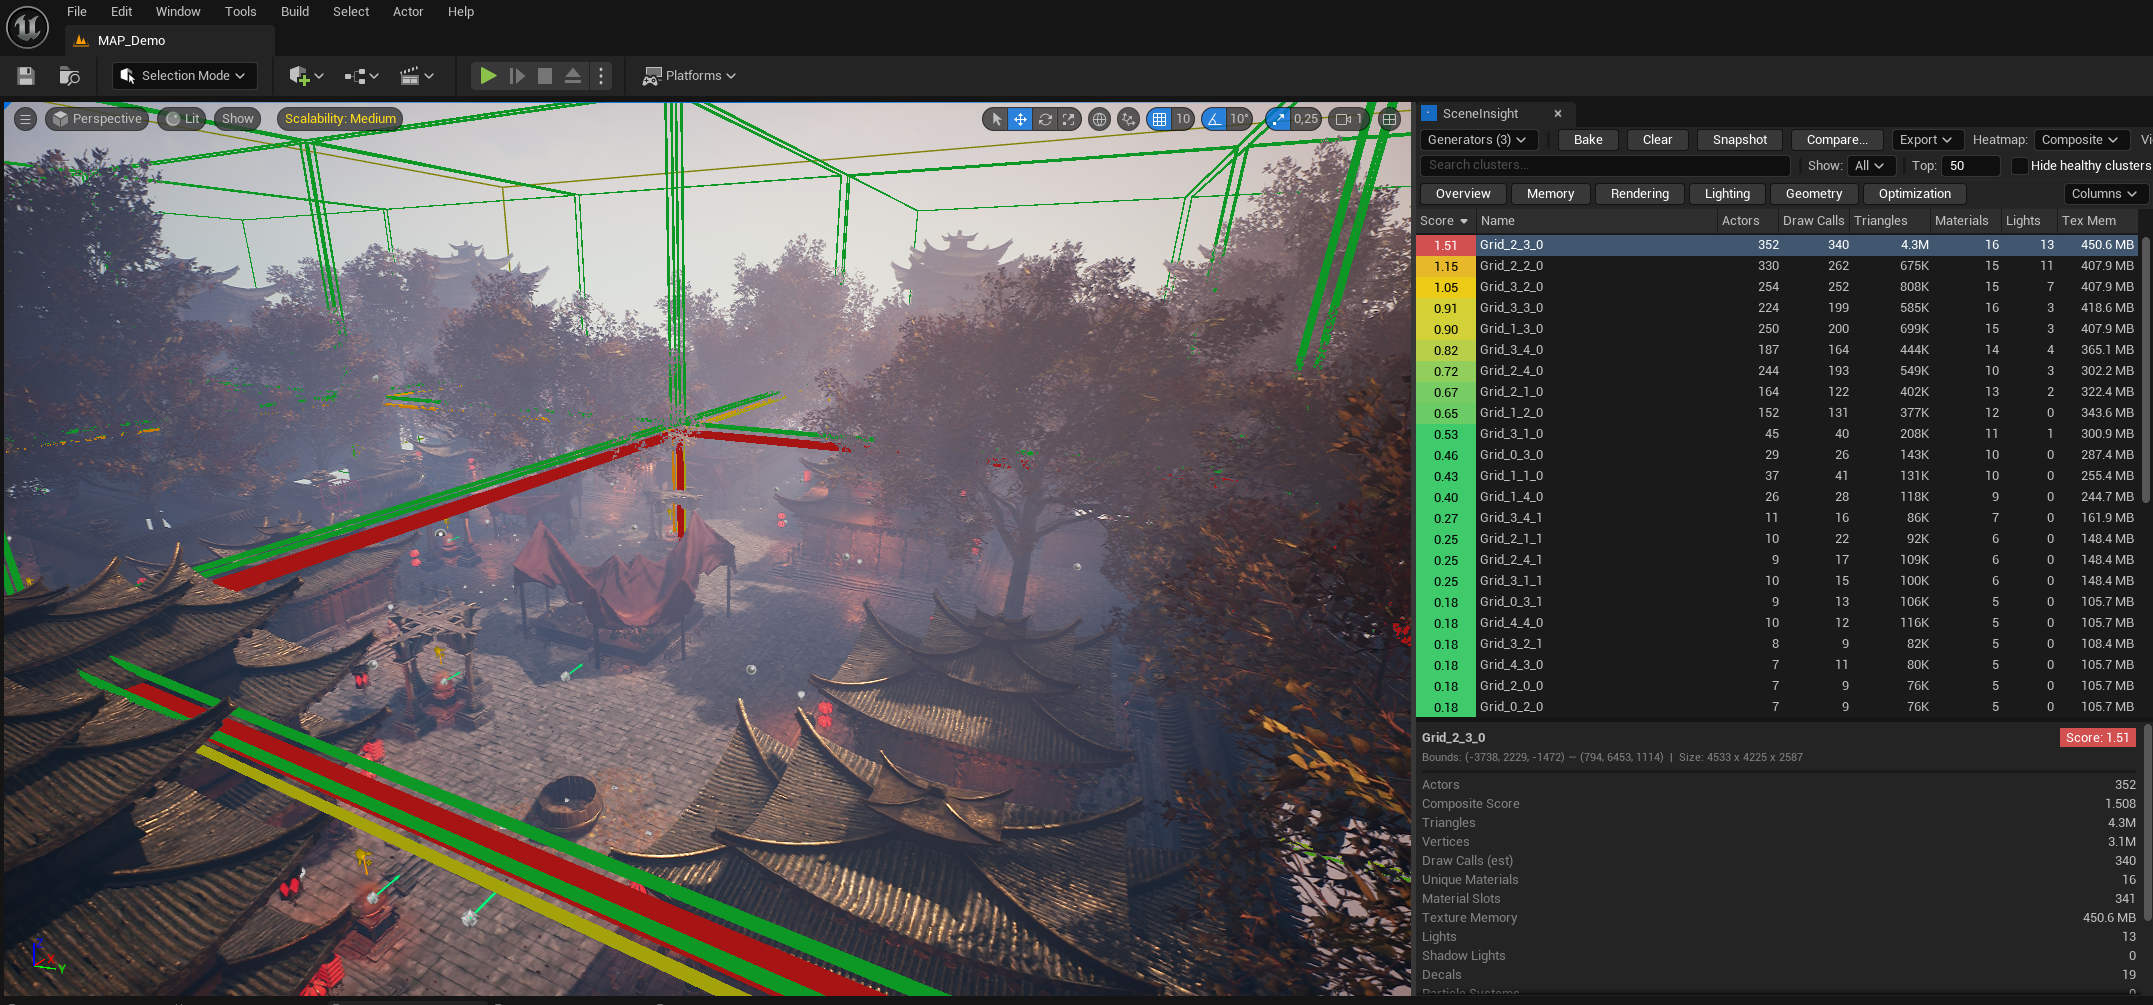
Scene Insight is an Unreal Engine editor tool that visualizes and analyzes level performance by spatial zones (clusters). It bakes per-zone metrics — draw calls, triangles, materials, lights, texture memory and dozens more — paints a color-coded heatmap directly in the viewport, and lists every zone in a sortable table you can filter, snapshot, compare and export.
- Engine: Unreal Engine 5.4+
- Category: Performance
- Type: Editor tooling (static / bake-time analysis — no runtime cost in your shipped game)
- Modules:
SceneInsightCore(runtime types),SceneInsightEditor(editor UI)
Why zones instead of a single number?
Profiling tools usually give you a single per-frame figure for the whole view. That tells you that a level is heavy, but not where. Scene Insight partitions your level into spatial clusters and scores each one against a performance budget, so you can answer questions like:
- Which corner of the map blows the draw-call budget?
- Where are 4K textures or shadow-casting lights piling up?
- Which zone regressed between this week's build and last week's?
What it measures
Scene Insight collects a deep set of static metrics per cluster, grouped into tiers:
| Group | Examples |
|---|---|
| Geometry | Triangles, vertices, static/skeletal mesh counts, Nanite ratio, LOD-saving potential, duplicate-mesh / ISM-conversion potential |
| Materials | Unique materials, material slots, opaque/masked/translucent breakdown, master-to-instance ratio, custom HLSL, two-sided, subsurface |
| Lighting | Static/stationary/movable counts, point/spot/rect/directional, shadow casters, overlapping-lights heuristic, IES & light functions, lightmap resolution |
| Memory | Texture memory, lightmap memory, mesh memory, audio memory, max texture dimension, virtual textures |
| FX / Misc | Niagara CPU/GPU emitters, Cascade systems, decals, foliage instances, physics actors & constraints, ticking actors |
Every cluster gets a single composite score computed against the active budget profile: 0.0 = healthy (green), 1.0 = exactly at budget, >1.5 = critically over budget (red).
The workflow
Choose generators → Bake → Read the heatmap → Drill into the table
        → Snapshot a baseline → Compare later → Export a report
- Generators decide how the level is partitioned into clusters (grid, octree, World Partition cells, tags/folders, or hand-placed volumes).
- Bake runs the generators and the static collector to fill in every metric.
- The viewport heatmap and cluster table show the results.
- Snapshots let you save a baseline and diff future bakes against it.
- Export produces CSV / JSON / Markdown / HTML reports for code review or CI.