Cluster Table & Filters
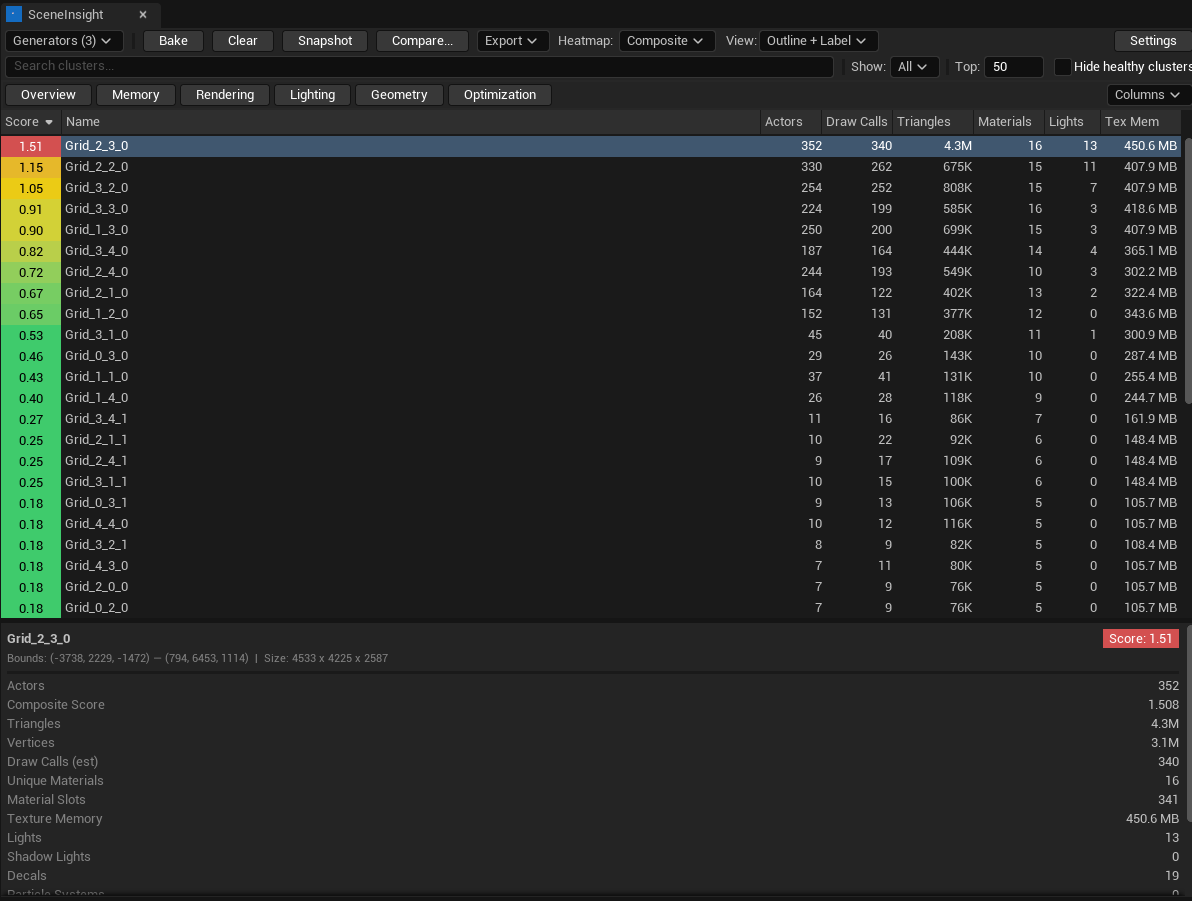
The table is the data view of your bake — one row per cluster, fully sortable and filterable, with a details panel for the selected zone.
Rows & selection
Each row is one cluster, showing its name, source generator, score and your chosen metric columns.
- Single-click a row to select it. The cluster highlights in the viewport and its full metric set opens in the details panel.
- Double-click a row to focus all editor viewports on that cluster's bounds — the fastest way to fly to a problem zone.
Sorting
Click any column header to sort by it; click again to flip direction. The default sort is Score, descending, so the worst zones are always on top after a bake.
Columns & presets
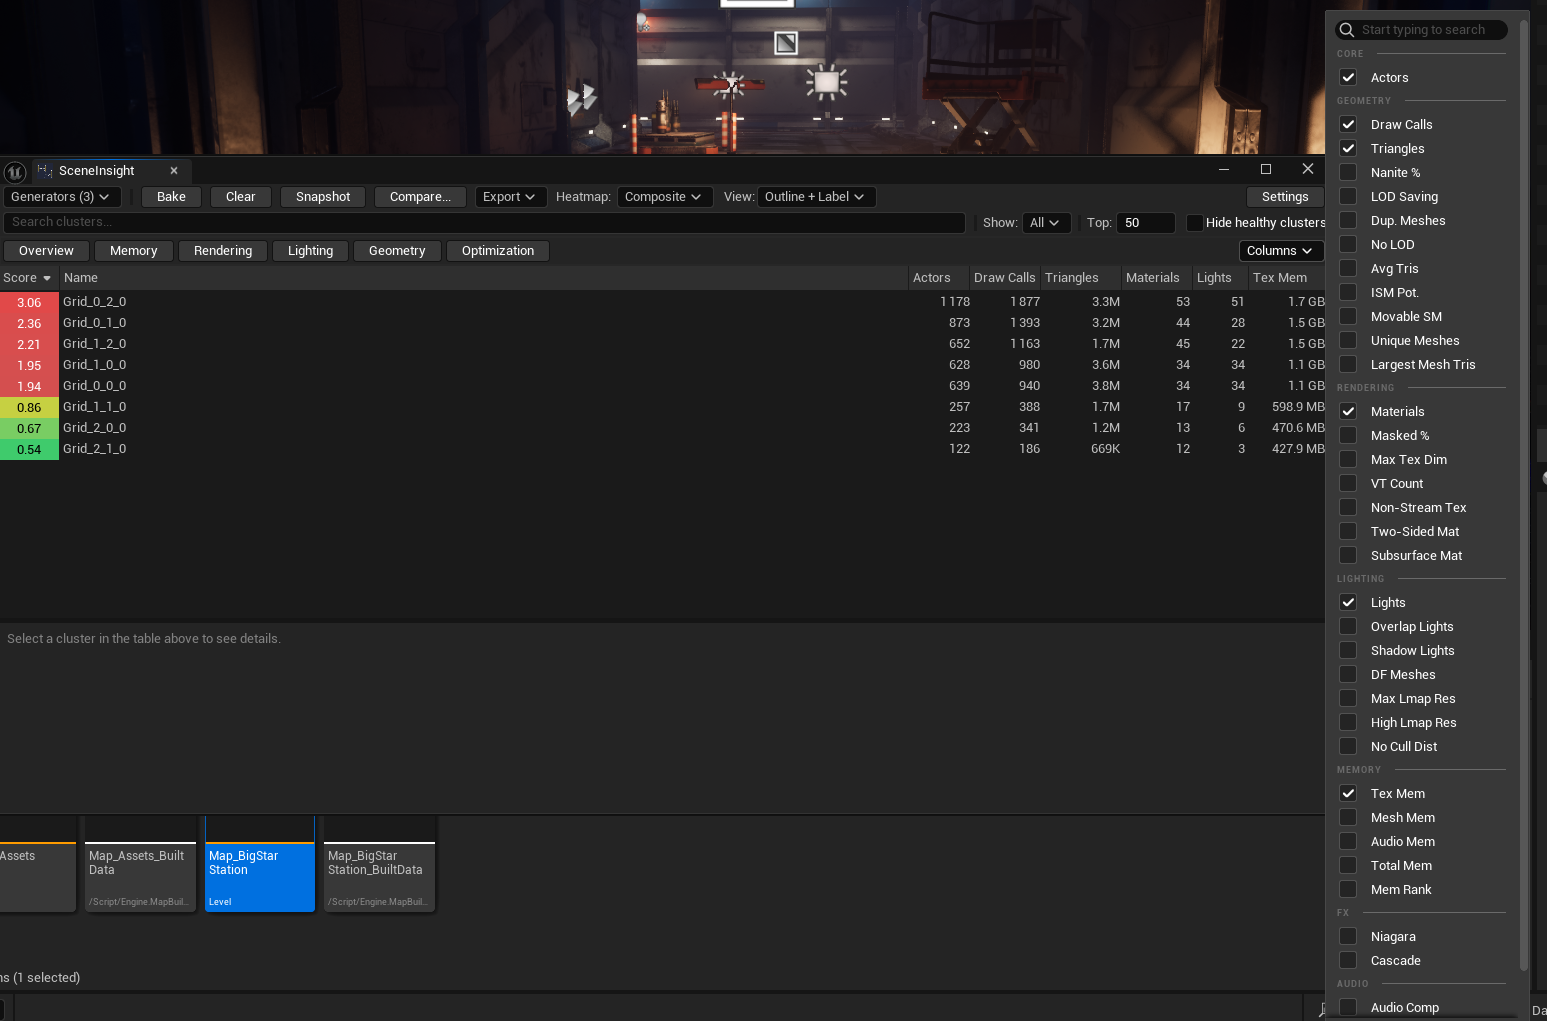
The table can show far more than fits on screen at once, so columns are managed:
- Column picker — toggle individual columns on or off.
- Presets — one-click column sets (Overview, Memory, Rendering, Lighting, Geometry, Optimization) that surface a related group of metrics, so you don't rebuild the layout by hand each time.
Pick a preset that matches what you're hunting, then sort by the most relevant column.
Filters
The filter bar sits between the toolbar and the table:
| Control | Effect |
|---|---|
| Search | Free-text match on cluster name |
| Filter type | All · Over Budget · Top N (see below) |
| Hide green | Hides healthy clusters so only at-risk zones remain |
Filter types
| Type | Shows |
|---|---|
| All | Every cluster (still subject to search and hide green) |
| Over Budget | Only clusters with composite score ≥ 1.0 |
| Top N | Only the N highest-scoring clusters (default N = 50), applied after sorting |
Set the filter to Over Budget, sort by Score descending, and you have an instant prioritized worklist. Use Top N when even "over budget" returns too many rows and you only want the worst offenders.
Details panel
Selecting a cluster opens the details panel, which lists the complete metric set for that single zone — every value described in Metrics & Scoring, not just the columns currently visible in the table. This is where you confirm why a zone scored the way it did before acting on it.
Clearing results
The Clear button in the toolbar empties the current cluster list and removes the viewport overlay without re-baking. Bake again whenever you want fresh numbers.