Getting Started
This guide walks you through your first level analysis end to end.
1. Open the panel
Tools → SceneInsight. The panel docks like any other editor tab.
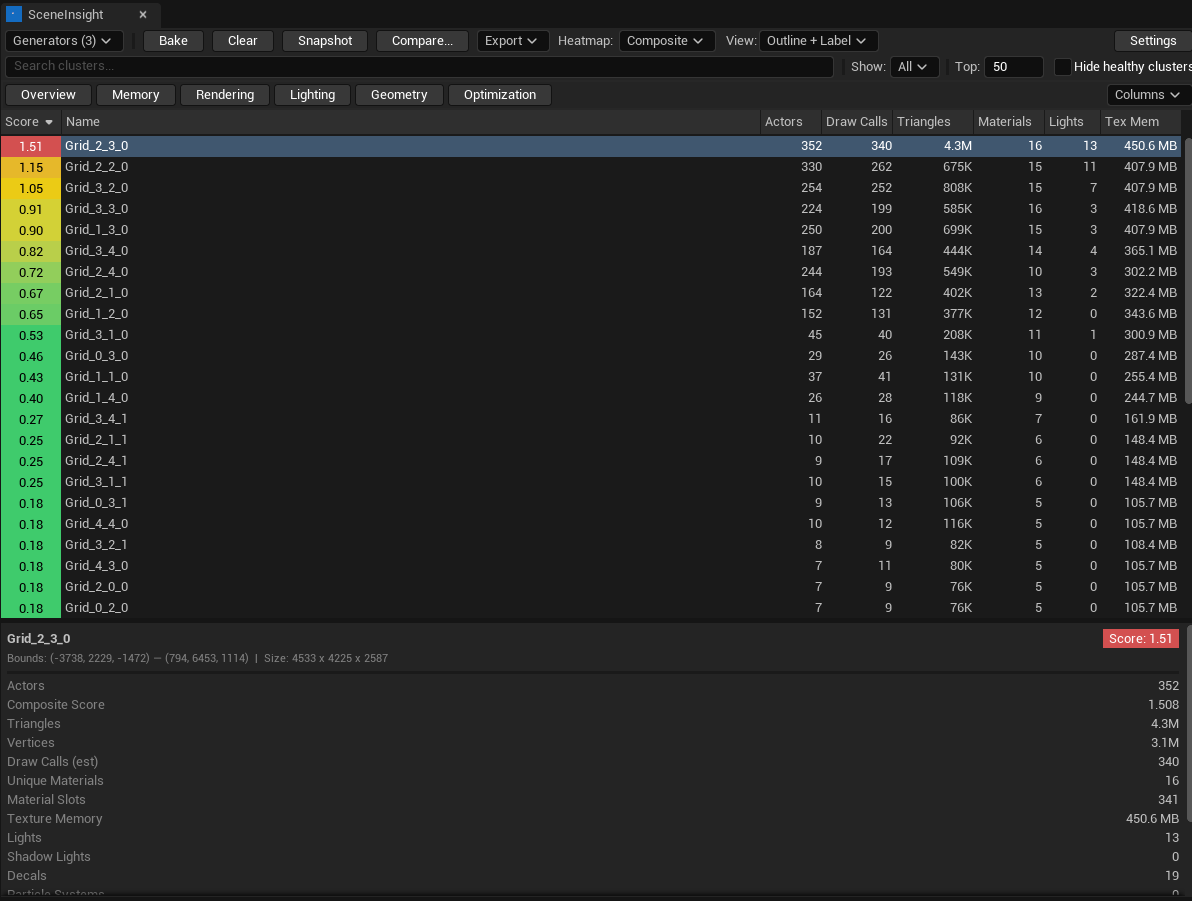
The panel has three regions:
- Toolbar (top) — generator picker, Bake, heatmap mode, viewport style, snapshot / compare, export, settings.
- Filter bar — search, filter type (All / Over Budget / Top N), and a hide green toggle.
- Cluster table — one row per zone, with a details panel for the selected cluster.
2. Choose how to partition the level
Open the Generators dropdown in the toolbar and enable the partitioning methods you want. Five are available — three are enabled out of the box:
- Grid — uniform cells (default 50 m).
- World Partition — mirrors streaming cells (no-op on non-WP maps).
- Manual Volume — any Cluster Volume actors you've placed.
- Octree — adaptive density: small cells in crowded areas, large cells in empty ones.
- Tag / Folder — groups actors by their Actor Tag or Outliner folder.
See Generators for the full breakdown and the priority rules when several are active.
For a first pass, leave the defaults. The Grid generator alone gives a clear, even heatmap of where cost concentrates.
3. Bake
Click Bake. Scene Insight runs every enabled generator, merges the resulting clusters by priority, then runs the static collector to fill in metrics for each one. Cluster boxes appear in the viewport and rows populate the table.
Baking is non-destructive — it reads your level and stores results in memory only. It never modifies actors or assets.
4. Read the heatmap
Each cluster box is colored by its composite score against the active budget:
| Color | Meaning |
|---|---|
| 🟢 Green | Healthy — well under budget |
| 🟡 Amber | Approaching budget |
| 🔴 Red / magenta | Over budget |
Switch the Heatmap dropdown to color by a single metric instead — Draw Calls, Triangles, Materials, Lights or Texture Memory. Change how boxes are drawn (Wireframe / Filled / Outline + Label / X-Ray) from the Viewport dropdown. Details in Viewport & Heatmap.
5. Find the offenders
In the filter bar, set the filter to Over Budget (or Top N) and sort the table by Score (descending). The worst zones float to the top.
- Click a row to select it — it highlights in the viewport and its full metrics appear in the details panel.
- Double-click a row to focus all viewports on that cluster's bounds.
6. Save a baseline (optional)
Click Snapshot to write the current results to a JSON file. After you optimize, bake again and click Compare to see exactly which zones improved or regressed. See Snapshots & Compare.
7. Export a report
Use the Export dropdown to write a CSV, JSON, Markdown or HTML report — handy for sharing in a PR or archiving in CI. See Export.
That's the full loop. Next, dial in your targets with a Budget Profile so the colors mean something for your platform.